Nayan Bobde

|

Data Analyst turning retail inventory chaos into allocation decisions that hold — SQL, Power BI and Python, applied where stockouts and overstock actually happen. Based in Bengaluru, India.

Nayan Bobde, Data Analyst
0% stockout reduction
0 records processed
0% revenue uplift
0% less manual reporting
0% inventory precision

Profile

I'm a result-driven Data Analyst with 2.4 years of experience specializing in retail and supply chain analytics. My work sits at the intersection of messy operational data and the decisions that depend on it — where a store runs out of stock, why a distribution centre is overloaded, and what a dashboard needs to show a stakeholder before Monday's meeting.

I build with SQL, Power BI (DAX & Power Query), Python and Excel, and I've worked hands-on with allocation tools like JDA and ODBMS systems to move from "we think we have a problem" to a measured, monitored fix. I care about dashboards that survive contact with a real stakeholder meeting, and KPIs that are still trusted six months after launch.

Nayan Bobde
LocationBengaluru, India
RoleOrder Allocation Analyst, Cognizant
FocusRetail & supply chain BI
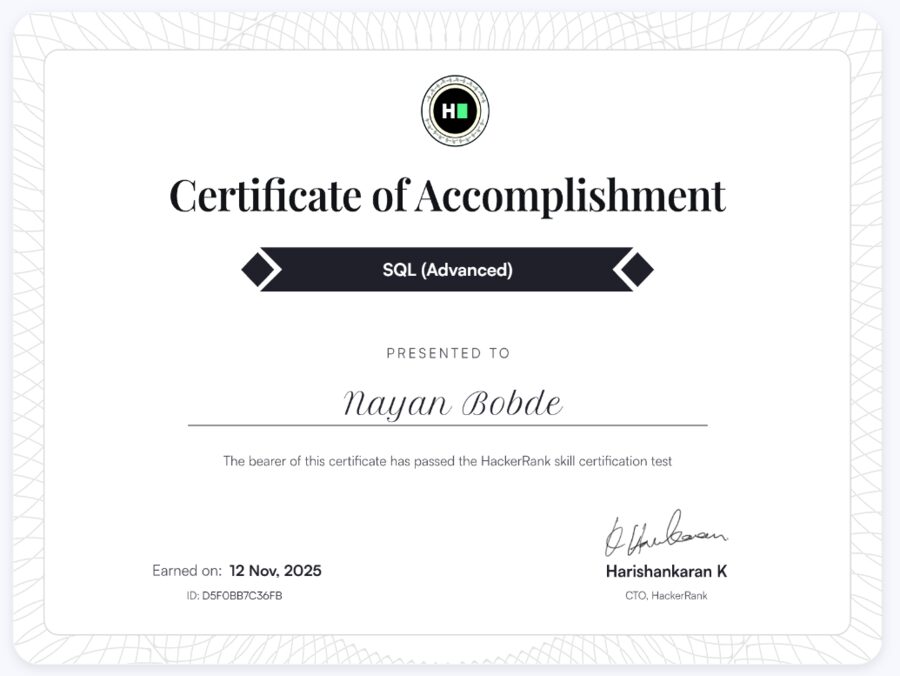
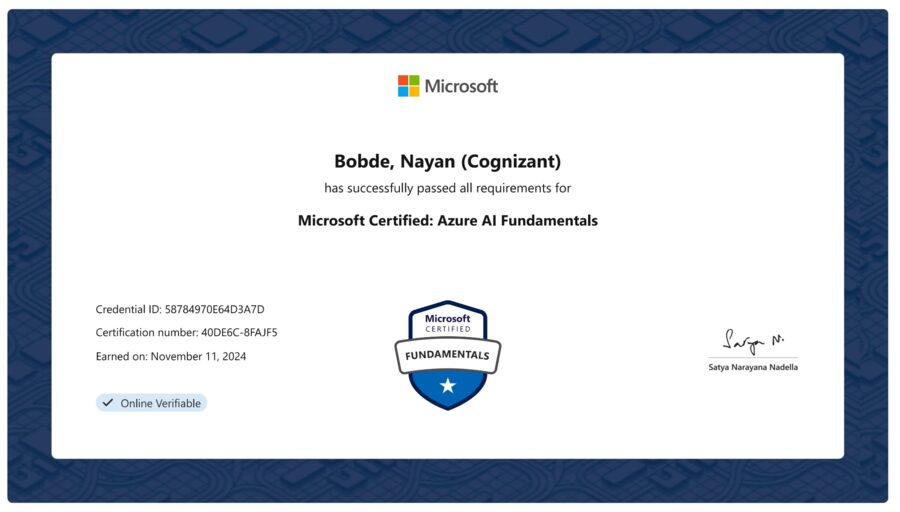
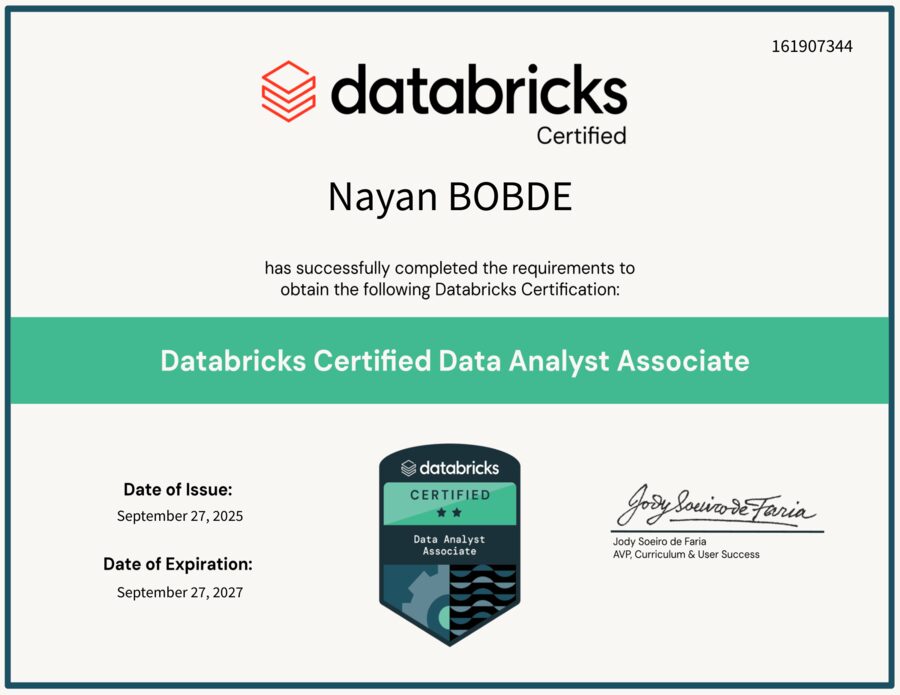
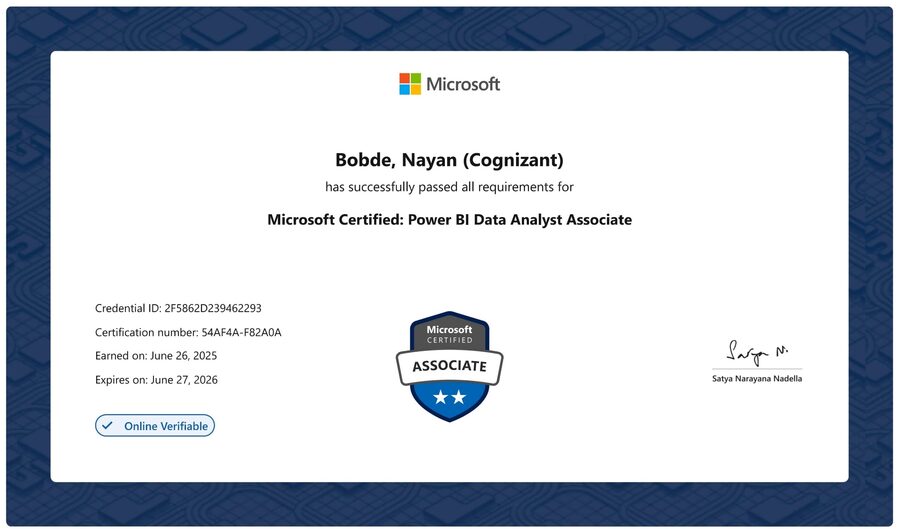
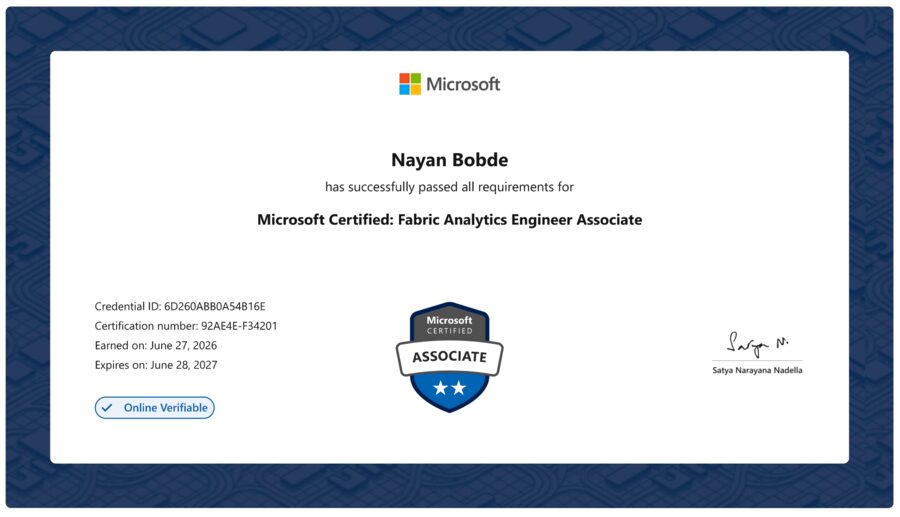
CertifiedPL-300 · DP-600

Experience

Order Allocation Analyst

Cognizant · Bengaluru, India · Oct 2023 – Mar 2026

Engaged with an apparel fast-fashion retail client to fix how inventory moved from distribution centres into stores.

  1. Worked with a global apparel retail client to analyze inventory flow from distribution centers to stores, identify allocation issues, and develop SQL and Power BI dashboards, processing 500K+ records across 20,000+ SKUs, multiple stores, and 3+ distribution centers.

  2. Designed and developed interactive Power BI dashboards for Buying, Planning, Merchandising, Supply Chain, and Distribution Center teams, enabling data-driven decisions through inventory health, sales, and supply chain analytics.

  3. Analyzed large-scale sales and inventory datasets using SQL and Power BI, developed DAX measures and calculated columns for KPIs including Weeks of Cover (WOC), In-Stock %, Stockout Rate, Sell-Through Rate, Allocation Accuracy, Inventory Value, Revenue, Gross Margin, DC Utilization, and Forecast Accuracy, and presented actionable insights for business planning and forecasting.

  4. Designed scalable Star Schema data models with Fact and Dimension tables, built efficient semantic models, and optimized dashboard performance by improving SQL queries, reducing unnecessary columns, leveraging reusable SQL Views, and implementing efficient DAX measures for faster dataset refresh and high-performance reporting.

  5. Created and optimized SQL Views for inventory, sales, and allocation reporting, streamlining data extraction, transformation, and dataset preparation while maintaining consistent business logic across Power BI dashboards.

  6. Collaborated closely with Buying, Planning, Merchandising, Supply Chain, and Distribution Center teams to gather business requirements, define KPIs, support User Acceptance Testing (UAT), validate KPI calculations, resolve business feedback, and ensure dashboard accuracy before production deployment.

  7. Identified distribution center allocation imbalances through SQL analysis and Power BI visualization, contributing to approximately 30% reduction in stockouts, 10% improvement in allocation accuracy, and 15% improvement in revenue. Implemented Row-Level Security (RLS) and Page-Level Security to provide role-based access and support data governance.

Case studies

Three projects, from the client engagement to independent build-outs.

Client engagement · Cognizant

DC-to-Store Allocation Fix

Fixing how an apparel retailer's stock moved from distribution centres into stores.

30%fewer stockouts
15%revenue uplift
500K+records

Problem

Stores across the client's network were running out of key SKUs while nearby distribution centres held excess stock — a classic allocation mismatch that was costing sales and inflating carrying cost at the same time.

Business background

The client is an apparel fast-fashion retailer allocating inventory from 3+ distribution centres into a large multi-store footprint, where fashion cycles leave little room for slow reordering.

My role

I analyzed inventory flow end to end — from DC receipt to store-level sell-through — and built the SQL and Power BI layer that made the imbalance visible and actionable, working with JDA and ODBMS as the allocation systems of record.

Tech stack

SQL ServerPower BIDAXPower QueryJDAODBMSExcel

Approach

Consolidated multi-store, multi-DC transactional data into a reporting layer, then modeled demand patterns in SQL to surface where allocation logic was systematically over- or under-shipping specific categories.

Solution

Automated Power BI dashboards replaced manual, spreadsheet-driven KPI tracking, giving planners a live view of allocation accuracy and inventory precision instead of a weekly static report.

Challenges

Reconciling data across DCs and store systems that weren't built to talk to each other, inside an allocation tool (JDA) with its own logic and constraints.

Impact

30% fewer stockouts, 10% better allocation accuracy, 85% inventory precision, 20% shorter reporting cycle, and a 15% revenue uplift in key categories — plus a 12% lower acquisition cost and 10% better marketing ROI from the demand signal this work surfaced.

Key learnings

The biggest wins came from making an existing manual process automatic and visible, not from adding new complexity — precision and trust in the numbers mattered as much as the model behind them.
Personal project

Inventory Optimization Dashboard

A SQL-based dashboard unifying warehouse and sales data to catch overstock before it happens.

18%less overstock
MS SQL+ Power BI

Problem & solution

Warehouse and sales data lived in separate places, making overstock hard to spot until it was already tying up capital. I integrated both into a single SQL-based dashboard with automated alerts, giving a single source of truth for stock health.

Tech stack

MS SQLPower BIExcel

Impact

Reduced overstock by 18% and improved forecasting accuracy through automated alerting instead of manual review.

Personal project

E-commerce Sales Insights Platform

Turning 100K+ transaction records into clearer revenue drivers and sharper marketing spend.

100K+records
22%marketing ROI

Problem & solution

Processed 100K+ e-commerce records in SQL to identify which products and channels actually drove revenue, then surfaced those drivers in Power BI so marketing spend could follow the signal instead of a hunch.

Tech stack

MS SQLPower BI

Impact

Improved marketing ROI by 22% by directing spend toward the revenue drivers the analysis identified.

Skills

Languages

Python
SQL (MySQL)
SQL (MS SQL Server)

Tools

Power BI
DAX
Power Query
Power Pivot
Excel (Advanced)
JDA
ODBMS
SSMS
Git
Jira

Databases & platforms

MS SQL Server
Data Warehouse Systems
Databricks

Core skills

Data Modeling
Dashboard Design
KPI Tracking & Alerts
ETL Pipelines
Data Warehousing
Data Cleaning
Reporting Automation
Predictive Analytics
Retail Analytics
Supply Chain Analytics
Agile Methodologies
Stakeholder Management
Training & UAT Support

Certifications

Education

Bachelor of Engineering, Information Technology

SCOE, Savitribai Phule Pune University · 2018 – 2023

Achievement

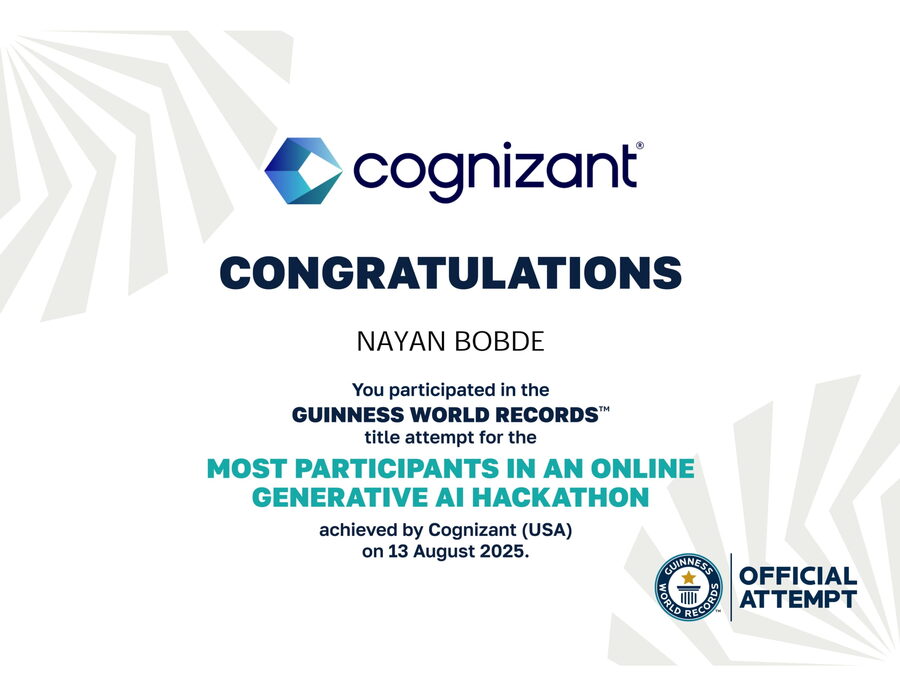
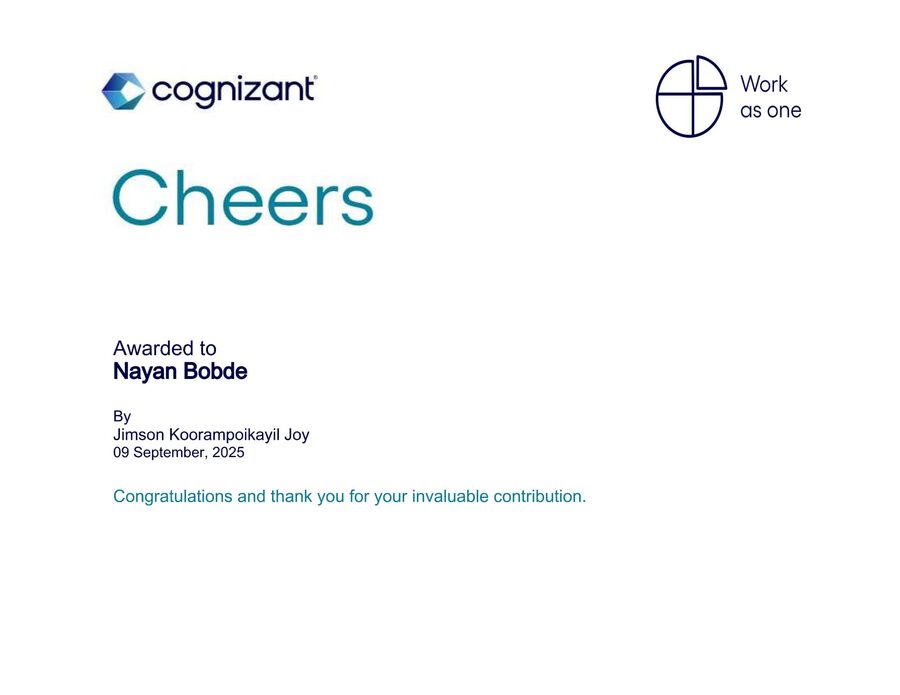
Star Award — Cognizant

Recognized for leading reporting automation initiatives that improved accuracy and cross-team collaboration.

Nayan Bobde

Let's talk data

Open to Data Analyst and BI roles in retail, supply chain, and analytics-driven teams.